Case Study - Google Ads
$449,769 in Cosmetics Store Sales From Google Ads at $0.17 per Click
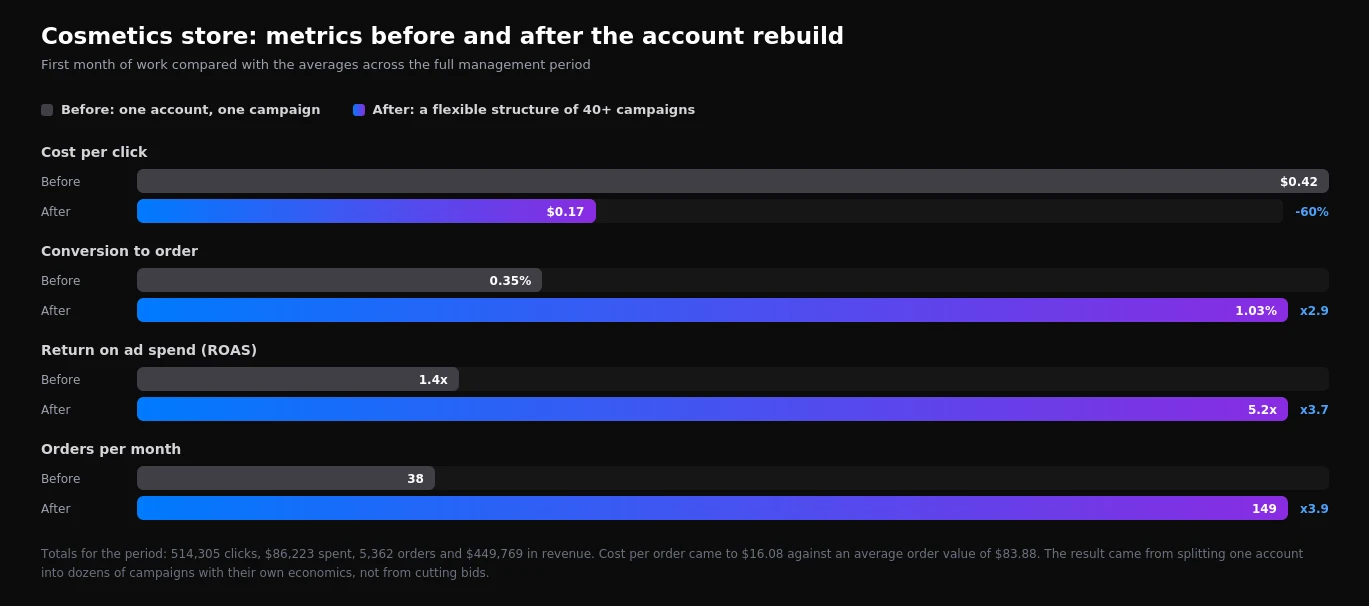
A single catch-all campaign was breaking even. We rebuilt the account into 40+ campaigns with their own budgets and return targets, cut cost per click by 60% and turned $86,223 of ad spend into $449,769 in tracked sales.
$449,769
Sales Revenue Generated
5.2x
Return on Ad Spend
$0.17
Average Cost per Click
Client
Online Cosmetics Retailer
Industry
E-commerce - Beauty & Cosmetics
Channel
Google Ads (Search, Shopping, DSA, Remarketing)
The challenge
An online cosmetics retailer with roughly four thousand SKUs: face and body care, colour cosmetics, fragrance and haircare. Average order value just under $84, in a category where the auction is crowded with large chains, marketplaces and dozens of comparable independent stores.
Advertising was already running in the account. The problem was not that it did not exist, but how it was built.
What we found in the account
- One campaign for the entire catalogue. Four thousand products, one ad group, one budget. The system had no way of understanding that a $60 serum and a $4 sample carry completely different economics.
- Broad match with no negatives. The search terms report contained "how to make a face mask at home", "DIY cosmetics", "cosmetics shop assistant jobs". The store was paying for all of it.
- No Shopping campaigns at all. The product feed was never connected, even though Shopping is the most natural format for cosmetics: people search for a specific product and want to see the photo and the price immediately.
- No remarketing. People who added items to the cart and did not complete checkout simply disappeared.
- Conversion tracking pointed at the wrong action. The recorded goal was reaching the cart page, not a paid order. The algorithm was optimising towards something that generated no revenue.
The consequences: clicks cost around 42 cents, conversion to order sat at 0.35%, and return on ad spend never exceeded 1.4 - which, once cost of goods was accounted for, meant the channel was effectively breaking even. When we first met, the owner was seriously considering switching Google Ads off entirely and moving the budget into social.
The standard reaction to expensive traffic is to lower bids. In this account the bids were beside the point. The problem was structural: there was no mechanism to separate profitable traffic from waste. Everything sat in one bucket, so any decision applied to the entire catalogue at once. Lower the bid and you lose the good queries too. Raise it and you overpay for the junk.
So the first job was not to optimise the campaign but to take it apart into pieces, each with its own economics and its own rules.
Our strategy
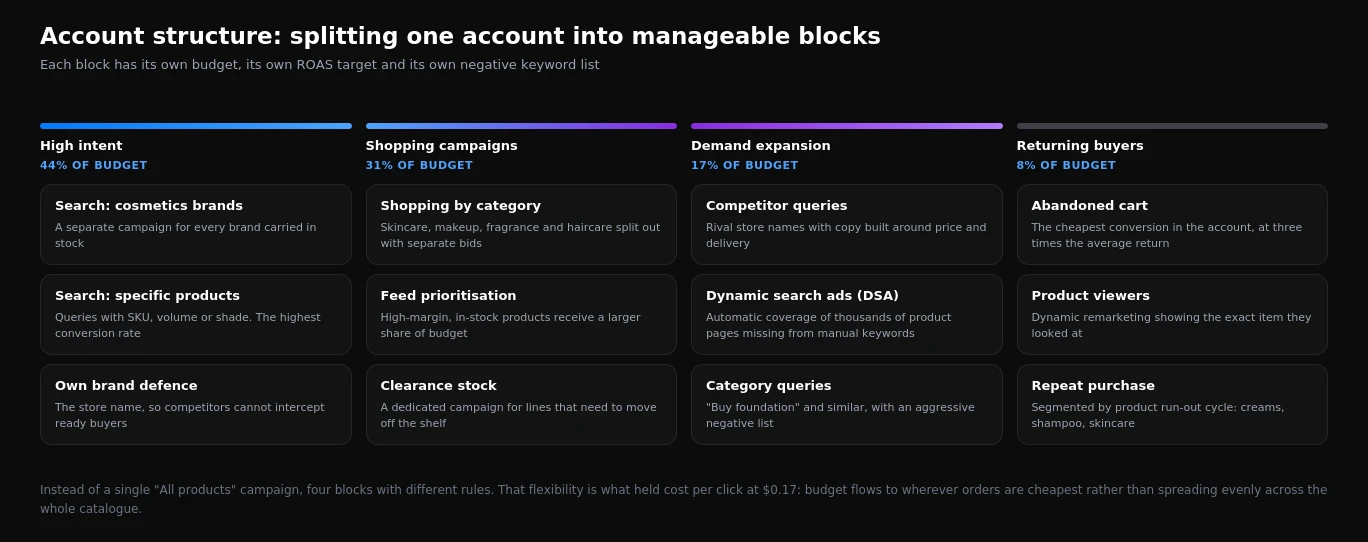
Everything was built around a single principle: the account has to be flexible. That means every type of demand lives in its own campaign with its own budget, its own return target and its own negative keyword list. Budget can then be moved surgically instead of shifting one bid for the entire store.
1. Search campaigns: from brand down to a specific shade
Instead of one campaign we built separate campaigns for every major manufacturer brand in stock, with ad groups inside them for individual product lines and items. The logic is simple: someone searching for a specific serum from a specific brand and someone searching "face cream" are at different stages and carry different value.
- Manufacturer brand campaigns. The highest conversion rate in the account. We deliberately held higher bids here because every one of those clicks paid for itself.
- Product-level ad groups. Queries with SKU, volume and shade. The ad repeated the query word for word, which kept quality scores high and pulled the cost per click down.
- Own brand defence. A cheap standalone campaign on the store name. Competitors bid on it regularly, and without this campaign a share of already-decided buyers went to them instead.
- Category queries. The broadest and riskiest tier. It received less budget but carried the most aggressive negative list.
2. Shopping campaigns and feed work
Shopping is the primary format for a cosmetics retailer, and the biggest gain came not from the campaign itself but from the feed. We rewrote product titles to a single formula, "brand + product type + volume + shade", because that is how people phrase their searches. We then labelled products by margin and stock level so budget went first to the items where the store actually earns.
| What we did to the feed | Why | What changed |
|---|---|---|
| Rewrote titles to a formula | Match how queries are phrased | More impressions in product results |
| Labelled products by margin | Push budget into profitable lines | Higher return without higher spend |
| Excluded out-of-stock items | Stop paying for what cannot ship | A whole class of wasted clicks removed |
| Separate clearance campaign | Move ageing stock off the shelf | Cash unlocked from dead inventory |
| Split Shopping by category | Different bids for skincare and colour | Controlled budgets instead of one pot |
3. Negative keywords: the cheapest optimisation in the project
For the first two months the search terms report was reviewed daily, then weekly. Over the full engagement the negative list grew past three thousand entries. The main groups we filtered out:
- Do-it-yourself intent: "homemade", "recipe", "how to make".
- Job seekers: "vacancy", "consultant", "beauty store jobs".
- Informational queries with no purchase intent: "difference between", "ingredients", "dermatologist review".
- Products the store did not carry but whose names were close to ones it did.
- Wholesale queries, since the store was retail only.
Every negative added immediately removes wasted clicks, and the freed budget flows automatically into the queries already producing orders. It works faster than any ad copy change and needs no client sign-off. Over the first three months, search term cleanup alone accounted for roughly half of the total drop in cost per order.
4. Competitor campaigns
A separate block bidding on rival store names. This traffic is always more expensive and converts worse, so it ran on a capped budget with its own ad copy built around concrete advantages: in stock now, next-day delivery, prices below the category average. We used competitor names only as keywords, never in ad text, as policy requires.
This block was never the most profitable part of the account, but it consistently brought in people who were already ready to buy and were simply choosing where.
5. Behaviour-based remarketing
Instead of a single "all site visitors" audience we split it into segments, each with its own message:
- Abandoned cart. The cheapest conversions in the account, at three times the project's average return.
- Viewed a specific product. Dynamic remarketing served the exact item the person had been looking at.
- Previous buyers. Segmented by consumption cycle: a face cream runs out in roughly two months, shampoo in about six weeks. Ads reached people exactly when their product was due to run out.
- Blog readers. The coldest audience, served collection-style ads rather than a single product.
6. Bidding strategy in three stages
Automated bidding was deliberately not switched on at the start. Clean data had to come first.
- Month one, manual bidding. While the account is still full of junk queries, an automated strategy simply spends the budget on them faster.
- Months two to four, maximise clicks with a cost cap. Accumulating statistics on the cleaned-up query set.
- From there, target ROAS per block. Brand campaigns and remarketing got one target; category queries and competitor terms got a far stricter one.
That last step was only possible because of the structure. Setting different return targets for different types of demand inside one shared campaign is not possible at all.
7. Conversion rate work on the site
Half the result sat outside the ad account. Conversion rose from 0.35% to 1.03%, driven by:
- Price and stock status made visible without opening the product page.
- Delivery terms moved onto the product page instead of hiding in a separate section.
- A sticky buy button on mobile scroll.
- Checkout reduced from four steps to two.
- Customer reviews added to the highest-traffic product pages.
- Conversion tracking corrected so the goal became a paid order, not a cart visit.
Breaking the result into components: account structure and negatives account for roughly 45% of the effect, feed and Shopping work about 25%, on-site changes about 20%, remarketing about 10%. None of these alone would have produced a 5.2x return. The combination did.
What did not work
Honestly, the failed hypotheses, because a real project always has them:
- Display to cold audiences. Cheap clicks, almost no orders. Switched off after three weeks and never revisited.
- A fully automated Shopping campaign across the whole catalogue. Early on it consumed budget on cheap, low-margin lines. It only started working once the feed was labelled.
- Bidding on very broad terms like "cosmetics". High volume, almost no purchase intent. Kept only with heavy qualifiers.
The result across the full period
| Metric | Full period |
|---|---|
| Clicks | 514,305 |
| Ad spend | $86,223 |
| Average cost per click | $0.17 |
| Sessions | 521,524 |
| Orders | 5,362 |
| Revenue | $449,769 |
| Average order value | $83.88 |
| Cost per order | $16.08 |
| Return on ad spend | 5.2x |
| Google Ads share of store revenue | 62% |
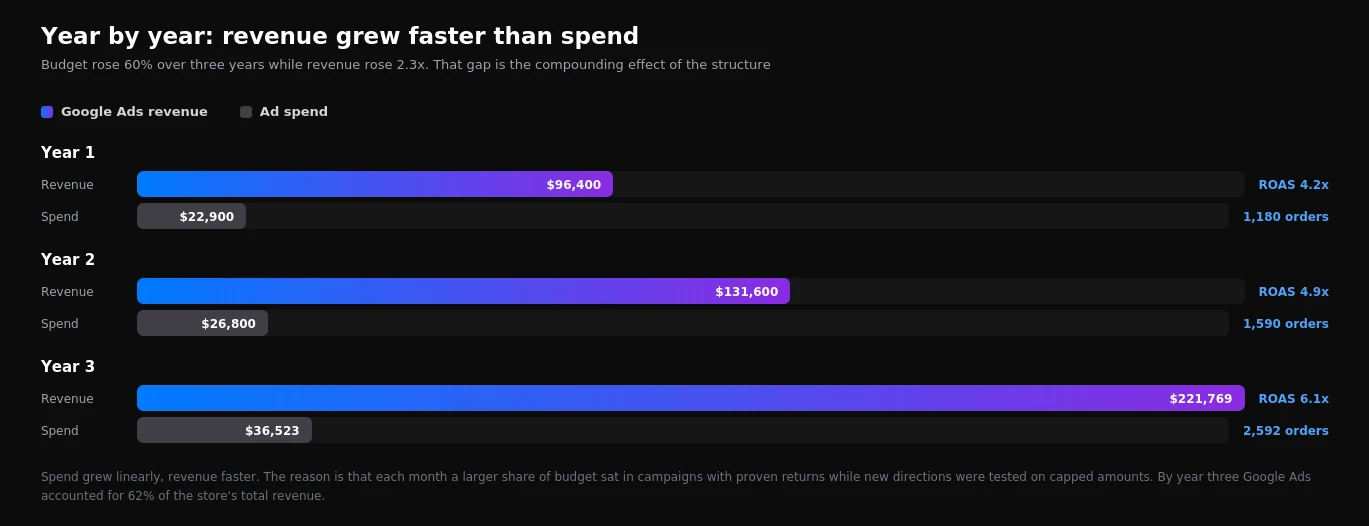
The number that matters most here is not the revenue but the share: by the end of the period Google Ads was producing 62% of the store's total revenue. The channel the owner had almost switched off became the primary source of sales.
What The Ad Experience Looked Like
One ad group, one clear promise.
Instead of one generic ad pointing at a generic page, each ad group's copy mirrored the exact search - landing on a page section built for that specific offer.
Authentic Cosmetics - In Stock Today
4,000+ products. Next-day delivery. Pay on receipt.
Execution Timeline
What we actually did, step by step.
Click any phase for the detail.
Weeks 1-2 Audit and clean analytics
Audited the account, traced where budget was leaking, and rebuilt conversion tracking so the recorded goal became a paid order instead of a visit to the cart page. Without that, every later decision would have been made on false data.
Weeks 3-6 Structural rebuild
Broke the single catch-all campaign into separate campaigns by manufacturer brand, product line and category, switched off Display expansion inside Search, and shipped a first negative keyword list of around 800 entries.
Months 2-3 Feed and Shopping
Rewrote product titles to a consistent formula, labelled the feed by margin and stock level, excluded unavailable items, and split Shopping into separate campaigns per category with their own bids.
Months 4-6 Remarketing and competitors
Built behaviour-based remarketing segments including abandoned cart, product viewers and repeat-purchase cycles, launched capped competitor campaigns, and added DSA to cover product pages missing from the manual keyword set.
Months 7-12 Automated bidding per block
Moved each block onto its own target ROAS once it had enough conversion data, and planned budgets around seasonal peaks instead of holding a flat monthly figure all year.
Years 2-3 Scaling and on-site conversion
Reduced checkout from four steps to two, surfaced pricing and delivery earlier, added reviews to high-traffic pages, and kept expanding the negative list past 3,000 entries to hold cost per click at $0.17 while volume grew.
Before vs. after
Want results like this?
Tell us about your goals - we'll show you exactly how we'd approach your account.
Get a Free ProposalFrequently asked questions
Why split one campaign into forty instead of optimising the one that existed?
Because a single campaign can only carry one budget, one bidding target and one negative list. A $60 serum and a $4 sample need completely different economics, and in a shared campaign any change applies to both at once. Splitting the account is what made it possible to fund what worked and starve what did not.
How did cost per click fall from $0.42 to $0.17?
Not by lowering bids. Three things did it: negatives removed the queries that were never going to convert, ad copy that repeated the query word for word lifted quality scores, and Shopping took over a large share of volume at a naturally lower cost per click than search text ads.
Is a 1.03% conversion rate good for e-commerce?
It is around the middle of the range for cosmetics, where a lot of traffic is comparison shopping. What matters here is that it tripled from 0.35%, and that the increase came from site changes rather than from buying more expensive traffic.
Why was automated bidding not switched on immediately?
Automated strategies optimise against the conversion data they are given. With broken tracking and a query set full of junk, they simply spend the budget on the wrong things faster. We only moved each block onto target ROAS once it had clean data behind it.
How much of this result came from the ad account versus the website?
Roughly 70% from the account, mostly structure, negatives and the feed, and roughly 20% from on-site conversion work, with remarketing making up the rest. The site changes were the cheapest part to implement and among the most effective.
Can the same approach work on a smaller budget?
Yes, with fewer blocks. This account averaged around $2,400 a month, which is not a large budget for e-commerce. On a smaller one you would start with brand campaigns, one Shopping campaign and abandoned-cart remarketing, then add tiers as data accumulates.
Oct 12, 2026
How to Calculate ROI, ROMI and ROAS: Formulas, Examples and Free Calculators
A 400% ROAS can still lose money. What ROAS, ROMI and ROI really measure, the exact formulas, break-even ROAS by margin, and five free calculators for ecommerce and lead generation.

Oct 10, 2026
Google Ads for Real Estate Agents 2026: "Sell My House" Costs $150 a Click, "Homes for Sale" $1.51
Seller searches are bid up by cash buyers, buyer searches go to the portals. Real CPC data for realtors and UK estate agents, why home valuation searches are the affordable route to listings, budget math and setup.