Sep 12, 2026
Mobile Converts 2-3x Worse: Why That Is Not a Reason to Cut Mobile Bids

The most common conclusion drawn from a device report goes like this: mobile converts half as well, so cut mobile bids. We tested that logic against four accounts where conversion tracking works, using twelve months of data. The first half of the statement held true in all four accounts. The second half held almost nowhere.
0 of 4
accounts where desktop converts better
up to 0.9x
the conversion rate gap between desktop and mobile
up to 0.1x
how much more a desktop click costs
0%
of conversions come from mobile, on 64% of spend
Desktop conversion rates are higher in all four accounts, by a factor of 1.5x to 2.9x. But a desktop click costs 1.2x to 3.1x more, which levels out the cost per conversion. In two accounts the gap between mobile and desktop is within 6%, in one account mobile is 24% cheaper, and in only one does desktop genuinely win. Across all four accounts, mobile produced 70.9% of conversions on 64.5% of the spend. Tablets and connected TVs are the real weak link: tablets are more expensive than mobile in three accounts out of four.
How we counted
This continues our series of analyses built on our own data. The sample is the same one used in the search terms analysis: four accounts where conversions are recorded, two in e-commerce and two in medical services. The period covers twelve months.
The data comes from the Google Ads API, segmented by device type. We did not redefine conversions: these are the actions recorded in each account, meaning purchases in the stores, form submissions and calls in the medical accounts. All money figures appear as ratios and indices, because the markets differ and absolute numbers explain nothing across them.
Tablets and connected TVs stayed in the sample even though they account for fractions of a percent of spend. Small line items like these are exactly the ones nobody ever checks.
First: desktop converts better in every account
No surprises here. The direction is identical in four accounts out of four, which makes it one of the most consistent patterns we have seen anywhere in our data.
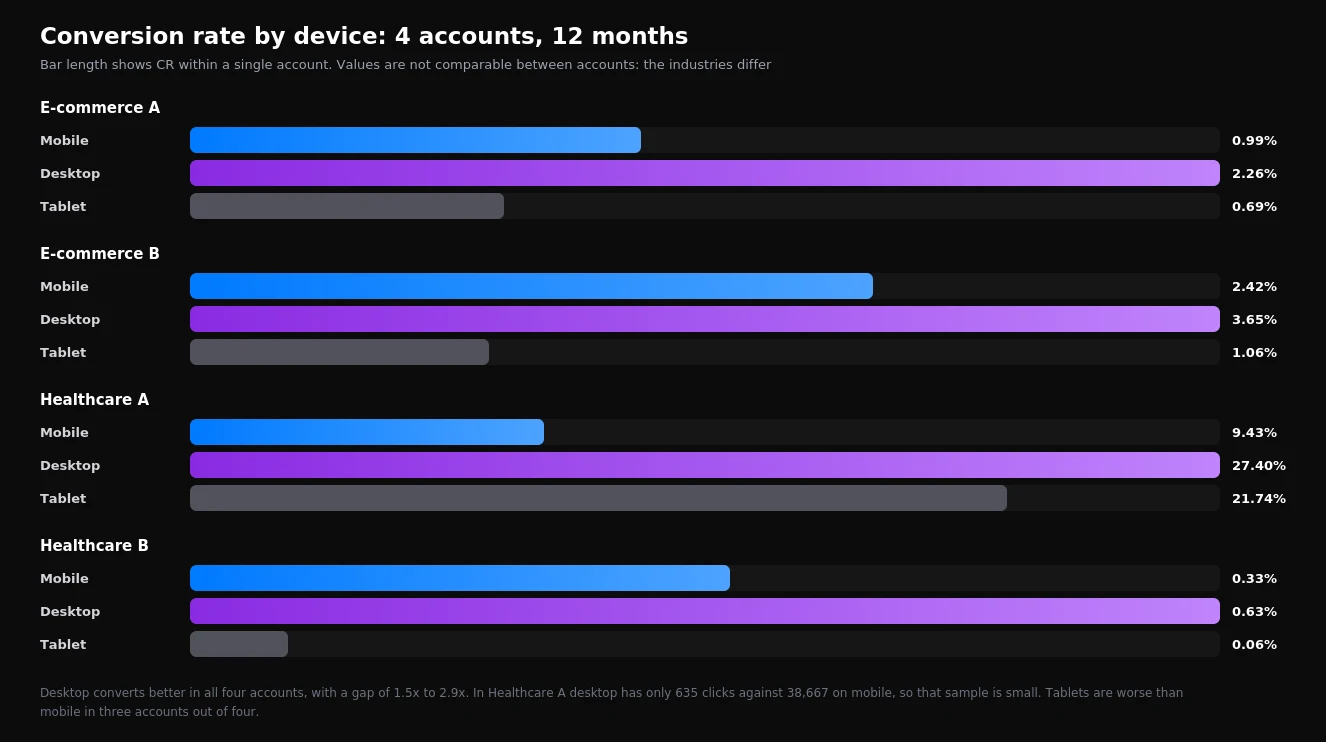
| Account | Mobile CR | Desktop CR | Gap | Mobile share of spend |
|---|---|---|---|---|
| E-commerce A | 0.99% | 2.26% | 2.3x | 72.3% |
| E-commerce B | 2.42% | 3.65% | 1.5x | 56.1% |
| Healthcare A | 9.43% | 27.40% | 2.9x | 94.1% |
| Healthcare B | 0.33% | 0.63% | 1.9x | 91.2% |
The reasons are well known: forms are harder to fill on a phone, products are harder to compare, and distractions are easier to find. On top of that, mobile tends to receive colder traffic, because people search from a phone between other tasks rather than when they sit down to decide.
This is the point at which somebody decides to cut mobile bids. And that is a mistake, because conversion rate is only half of the calculation.
Cost per conversion equals cost per click divided by conversion rate. There are two factors in that expression, and looking at only one of them means missing half the picture. A device with half the conversion rate and half the click price delivers exactly the same cost per conversion.
Second: desktop clicks cost more
This is the part of the report that gets looked at far less often.
| Account | How much pricier a desktop click is | How much higher desktop CR is | Which wins |
|---|---|---|---|
| E-commerce A | 2.2x | 2.3x | a draw |
| E-commerce B | 1.9x | 1.5x | mobile |
| Healthcare A | 3.1x | 2.9x | a draw |
| Healthcare B | 1.2x | 1.9x | desktop |
In three accounts out of four, the pricier desktop click eats almost the entire desktop conversion advantage. That is not a coincidence: desktop carries less traffic and more competition for the same auction, so bids there have always run higher.
Third: cost per conversion nearly evens out
Put both factors together and the picture inverts.
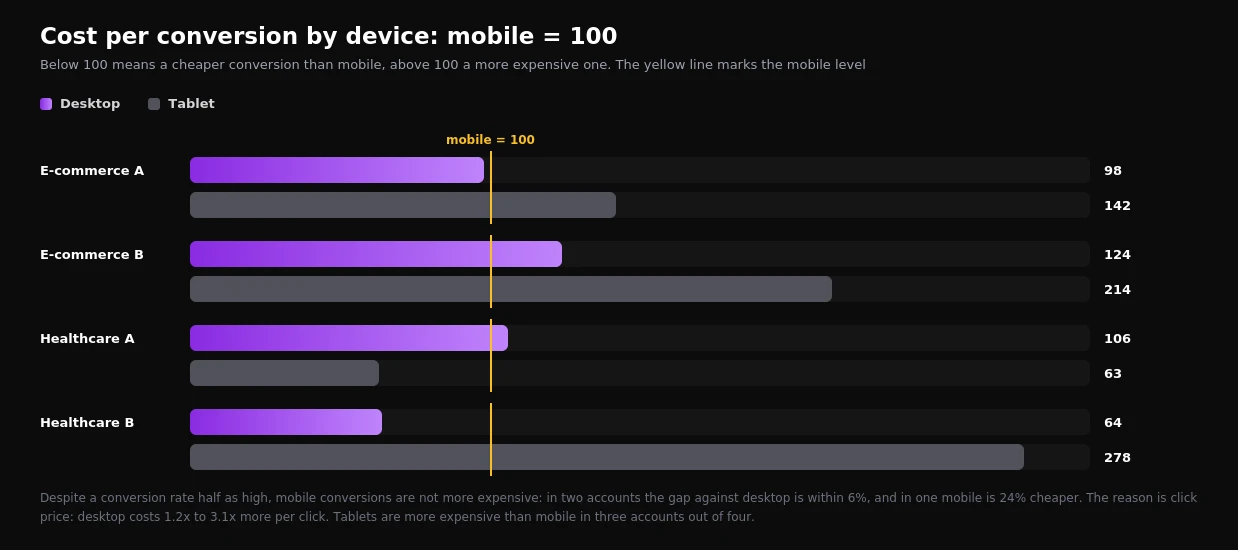
| Account | Mobile | Desktop | Tablet |
|---|---|---|---|
| E-commerce A | 100 | 98 | 142 |
| E-commerce B | 100 | 124 | 214 |
| Healthcare A | 100 | 106 | 63 |
| Healthcare B | 100 | 64 | 278 |
Read it like this: 100 is the cost per conversion on mobile within that same account, below 100 is cheaper than mobile, above 100 is more expensive.
In two accounts the mobile to desktop difference sits within 6%, which means there is no difference at all. In one store mobile is almost a quarter cheaper. And in only one account is desktop genuinely cheaper, by 36%.
Across all four accounts, mobile delivered 70.9% of conversions while consuming 64.5% of the budget. Desktop delivered 28.2% of conversions for 31.5% of spend. In aggregate, mobile works slightly harder than its share of spend.
The four accounts combined
Adding the accounts together and comparing share of spend against share of conversions shows which devices earn their budget and which do not.
| Device | Share of spend | Share of conversions | Cost per conversion index |
|---|---|---|---|
| Mobile | 64.5% | 70.9% | 100 |
| Desktop | 31.5% | 28.2% | 123 |
| Tablet | 1.2% | 0.9% | 159 |
| Connected TV | 2.7% | 0.1% | 4,230 |
Mobile is the only device in the sample that returns a larger share of conversions than the share of spend it takes. On desktop the gap is small and within noise. The last two rows are where the losses actually sit, even though together they carry under 4% of the budget.
Connected TV deserves a second look: 2.7% of spend against 0.1% of conversions means a conversion from a TV screen costs roughly forty times a mobile one.
A minus 30% mobile bid adjustment based on conversion rate alone would, in three of our four accounts, have penalised the cheapest or equally priced traffic in the account. In the store where mobile is 24% cheaper, it would have directly raised the average cost per conversion.
When desktop really is cheaper
There is one such case in the sample, and it is worth pausing on. In Healthcare B a desktop conversion costs 36% less, which on the face of it argues for shifting budget.
But conversions in that account are mostly phone calls, and part of the landing page addresses passed through a redirect that dropped the click parameters. Mobile traffic suffers first under that setup: people call rather than fill in forms when they are on a phone, and those calls are the easiest thing to lose.
So we do not actually know whether mobile is weaker there or simply measured worse. The correct order of operations is to repair the measurement first and draw device conclusions afterwards. We covered how to check that in our piece on conversion setup.
Tablets: the one category that is consistently bad
Tablets take between 0.9% and 1.7% of spend, which is exactly why almost nobody looks at them. They also carry the worst numbers in the sample: a cost per conversion index of 142, 214 and 278 in three accounts. Only in Healthcare A did tablets come out cheaper than mobile, and that was on a sample of 322 clicks, which is too thin to trust.
Tablet conversion rates are the lowest too: 0.69%, 1.06% and 0.06% in those same three accounts.
What to do: pull your own device report for a full year, and if tablets are consistently more expensive, reduce the bid or exclude them. In search, shopping and display campaigns a minus 100% adjustment is available at campaign level. Performance Max has no device control at all, so there the only option is to factor it into expectations.
Connected TV: 2.7% of spend and 0.1% of conversions
Across the sample, connected TVs took 2.7% of spend and returned 0.1% of conversions. In one store that meant 4.2% of the annual budget, at a cost per conversion more than forty times the mobile figure.
TV screen traffic arrives through video formats and partly through automated campaigns. For brand awareness that can be justified, but then it should be written into the campaign's objectives. If a campaign is there to generate enquiries, TV screens do not belong in it.
What to do: in video campaigns the television device type can be excluded in campaign settings. If the TV spend comes from Performance Max, there is no dedicated switch, and the only way to limit it is through the campaign's asset mix, video assets in particular.
One thing worth knowing: automated bidding ignores your adjustments
Suppose you decide to cut mobile bids anyway. It is worth knowing that in most modern campaigns this changes nothing.
If a campaign runs on target CPA, target ROAS or maximise conversions, the algorithm does not apply device bid adjustments. It already evaluates device as one signal in every auction, and more precisely than a single campaign-level percentage ever could. The only adjustment that still carries weight is minus 100%, which excludes the device entirely.
In practice that means two things. First, device adjustments set long ago under manual bidding and forgotten after the switch to automation now do nothing at all, and we do find such leftovers in accounts. Second, the real choice under automated bidding is binary: keep the device or exclude it. There is no longer a middle option of "slightly less".
Exclude when a year has produced enough clicks on that device to draw a conclusion, and the cost per conversion is consistently several times worse than other devices, not ten percent worse. In our sample that description fits tablets in three accounts and connected TV in one. It fits mobile nowhere.
What to do in your own account in half an hour
- Open the device report for twelve months. Shorter periods leave too few conversions per device to compare.
- Add cost per conversion to the table, not just CR. If the account records several conversion types, compare the same action across devices.
- Calculate the index: cost per conversion on the device divided by cost per conversion on mobile. That exposes the real gap without currency and without account averages.
- Check how mobile calls are recorded. If some of your conversions are phone enquiries, mobile is almost always measured worse than desktop.
- Look at tablets and TV screens separately. They are the smallest line items and frequently the most expensive.
- Check for leftover device adjustments. Under automated bidding they do nothing except full exclusion, and they only mislead whoever reviews the settings after you.
- Only act where the gap is stable. If the difference stays within 10%, or the device has fewer than thirty conversions, that is noise rather than signal.
If mobile genuinely is more expensive for you, the cause is almost always on the site rather than in the auction. Check load speed from a phone, the number of fields in the form, whether the price is visible without scrolling, and whether the call button works. That pays off more than a bid adjustment, because it fixes the cause instead of hiding the symptom.
What this data does not prove
Four accounts are an illustration, not statistics, and these figures cannot be presented as a market norm.
There is also a technical limitation worth stating plainly. Some journeys start on a phone and finish on a computer, and cross-device attribution is imperfect. High desktop conversion rates therefore partly include the work done by mobile ads that brought the person in earlier.
In the medical accounts the desktop samples are small: 635 and 5,657 clicks against tens of thousands on mobile. Within a single device, different campaign types are also mixed together, and those carry different objectives and different click prices.
One thing the data does show reliably: the conclusion "CR is lower, so cut the bids" does not survive contact with even four accounts. Device decisions are made on cost per conversion, and only after you have confirmed that conversions on that device are recorded correctly in the first place.
Earlier in this series: a structural review of 8 accounts and an analysis of search terms, plus a case study on how we run this kind of review. If you want us to look at your device report and tell you where you are overpaying, talk to our team.
Want results like this for your brand?
Get a free strategy call and a tailored proposal within one business day.
Get a Free Proposal