Sep 14, 2026
Performance Max Beat Search in 100% of the Accounts We Audited. We Tested Three Explanations

In every account we audited where Performance Max and regular search campaigns ran side by side, a conversion from PMax cost less. Not in most accounts, but in all of them without exception. The gap ranged from 27% to six times cheaper.
The obvious conclusion writes itself: move the whole budget into Performance Max. Before doing that, we tested three explanations that could turn the gap into an illusion. One was not confirmed, the second was confirmed only in part, and the third led to the most interesting story of the entire audit.
0%
of audited accounts where PMax beat search
up to 0x
cheaper conversions than search campaigns
up to 0%
of PMax search conversions came from the company's own name
0%
of PMax conversions in one account came from outside search
Micro-conversions do not explain the gap: both channels count the same actions in the same proportions. Branded queries explain it only in part: they account for 12.5% to 44% of PMax search conversions, but even with brand removed from both channels, PMax stays 2-6 times cheaper. Inventory outside search does not explain the gap in e-commerce, where 97-99% of PMax conversions come through search queries. In one healthcare account, however, 96% of PMax conversions came from outside search, and that is exactly where we saw a fivefold jump in conversions without any rise in spend. The conclusion: in retail the PMax advantage is most likely real, while in lead generation it needs checking against a CRM before anyone believes it.
Why this question matters right now
Google is steadily moving advertisers towards automation. Dynamic Search Ads are being migrated to AI Max automatically, some legacy search settings are being upgraded without the advertiser's involvement, and Performance Max receives an ever larger share of budget by default. We covered these changes in our pieces on the DSA to AI Max migration and the September auto-upgrade.
That makes the question "is the automated campaign really cheaper" anything but theoretical. The answer decides how budgets get allocated for years to come, and a mistake in either direction is expensive: either overpaying for manual campaigns, or moving budget into a campaign whose conversions partly do not exist.
Where the data comes from
These are accounts we audited: online stores and healthcare companies. The sample includes only accounts where Performance Max and search campaigns ran at the same time throughout the year and conversions are recorded correctly. The period covers twelve months, from September 2025 to September 2026.
We used three slices from the Google Ads API: spend and conversions by campaign type, conversions broken down by conversion action in each channel, and Performance Max search category insights, meaning the groups of queries on which PMax earned clicks and conversions in search. Company names are omitted and costs are shown as indices.
The starting point: how much cheaper PMax is
Take the cost per conversion in each account's search campaigns as 100 and see what a Performance Max conversion costs against that.
| Account | Search campaigns | Performance Max |
|---|---|---|
| E-commerce A | 100 | 73 |
| E-commerce B | 100 | 26 |
| Healthcare A | 100 | 16 |
| Healthcare B | 100 | 18 |
Even in the most modest case PMax is a quarter cheaper. In the rest it is roughly 4-6 times cheaper. A gap like that cannot be put down to small differences in setup, so we set out to test the explanations one at a time.
Explanation 1. PMax counts easier conversions
The most common theory: Performance Max optimises towards anything marked as a conversion, so it collects cheap actions such as contact page views, phone number taps or checkout starts, while search campaigns supposedly count genuine purchases and enquiries. We broke each channel's conversions down by conversion action.
| Account | PMax conversion mix | Search conversion mix |
|---|---|---|
| E-commerce A | 100% purchases | 100% purchases |
| E-commerce B | 61% purchases, 39% order completions | 64% purchases, 36% order completions |
| Healthcare A | 98.5% callback requests | 98.9% callback requests |
| Healthcare B | 100% calls | 100% calls |
The mix is the same. Both channels count the same actions in practically the same proportions. The easier-conversions theory does not hold in these accounts.
In one of the stores, two actions tied to the same process are both marked as primary: purchase and successful order completion. If both fire on the same order, every sale is counted twice. That does not affect the ratio between channels, because the duplication is identical in both, but the absolute cost per conversion looks twice as good as it really is. The rule is simple: one business event, one primary conversion action.
Explanation 2. PMax takes branded queries
The second theory is more serious. Someone searching for a store by name is almost certain to buy, and advertising adds little. If Performance Max serves on those queries, it collects cheap conversions the business would have got anyway.
Search category insights make this testable. We picked out the categories whose names contain the company's own name and calculated their share of PMax conversions.
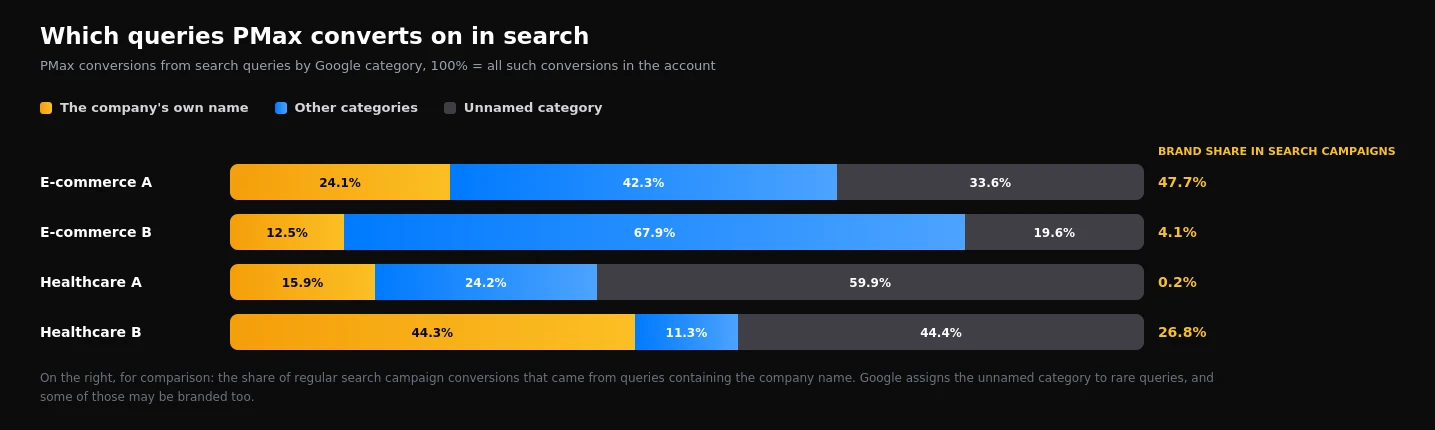
Branded queries account for 12.5% to 44.3% of PMax search conversions. Another 19.6% to 59.9% fall into the unnamed category, which is how Google labels rare queries, and some of those may be branded too. So brand genuinely feeds Performance Max to a noticeable degree.
But there is a twist that rarely gets mentioned. Regular search campaigns live off brand too. In one store, 47.7% of search campaign conversions came from queries containing the store's name, and in one healthcare account 26.8%. Brand flatters both channels.
To make the comparison fair, we removed branded conversions from both channels while keeping all of the spend. That estimate is conservative: part of the money really did go on branded clicks, so the true non-branded cost per conversion is somewhat lower.
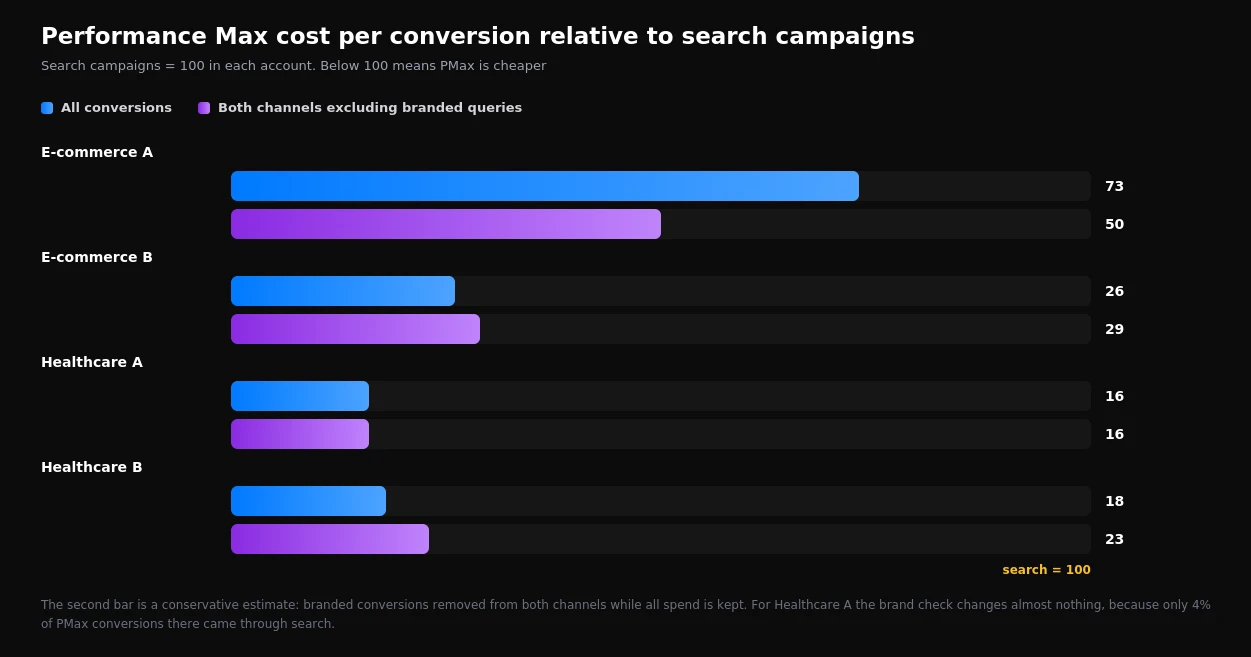
| Account | PMax, all conversions | PMax, both channels without brand |
|---|---|---|
| E-commerce A | 73 | 50 |
| E-commerce B | 26 | 29 |
| Healthcare A | 16 | 16 |
| Healthcare B | 18 | 23 |
Without brand, PMax is still 2-6 times cheaper than search. In the first store the gap actually widened: half of the search campaigns' "success" there rested on people looking for the store itself. Without branded queries, search cost per conversion almost doubles.
The verdict: brand explains part of the picture, but not the gap between channels. The practical takeaway from this section matters more than the verdict itself: never compare channels on an average cost per conversion that blends brand and non-brand.
How to calculate non-branded cost per conversion yourself
- Performance Max: open the campaign's search category insights for a full year and note the conversions for every category whose name contains your brand.
- Search campaigns: in the search terms report, filter to queries containing your brand name and add up their conversions.
- Subtract branded conversions from the total in each channel.
- Divide the channel's total spend by its non-branded conversions. This is a conservative estimate, since some of the spend went on branded clicks.
- Compare the resulting figures across channels. That comparison, not the average cost per conversion, is what should drive budget allocation.
Set up brand exclusions in Performance Max and move branded queries into a separate search campaign with its own budget. Branded traffic then stays cheap and visible, and PMax and non-branded search are judged on what they genuinely bring in. Review PMax search category insights monthly: they quickly show whether brand has started leaking back into the campaign.
Explanation 3. The conversions do not come from search
The third theory: Performance Max buys cheap traffic on the Display Network, YouTube, Gmail and Maps, where conversions can be accidental or low quality. It can be tested by comparing conversions from search categories against the campaign's total conversions.
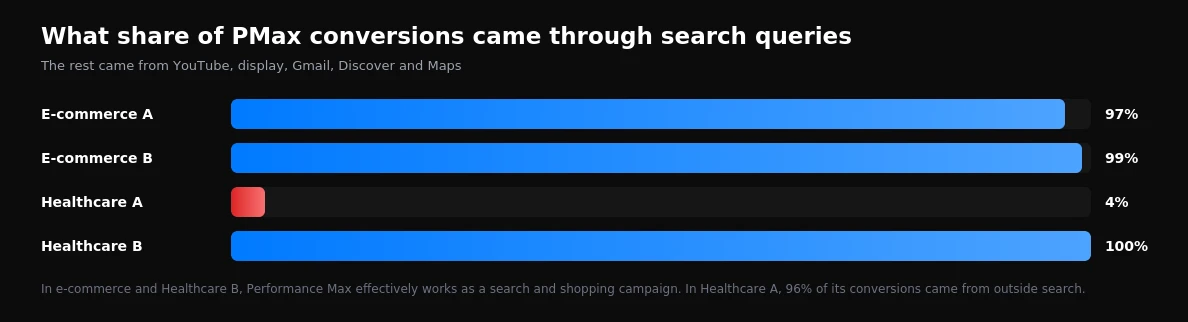
In both stores and in Healthcare B, between 97% and 100% of PMax conversions came through search queries. Here Performance Max effectively works as a search and shopping campaign, and the display "junk" theory does not hold.
Interestingly, in the first store Performance Max outperformed not only text search campaigns but also standard shopping campaigns running the same product ads: a conversion from standard shopping cost 81% more. So the advantage is not simply down to the shopping ad format with its image and price.
In Healthcare A, however, only 4% of Performance Max conversions came through search. The remaining 96% came from somewhere else. And that is where the story gets genuinely interesting.
Healthcare A: three periods in one account
The conversion in this account is an on-site event: a callback request submitted through a website widget. We looked at how the number of those conversions changed month by month.
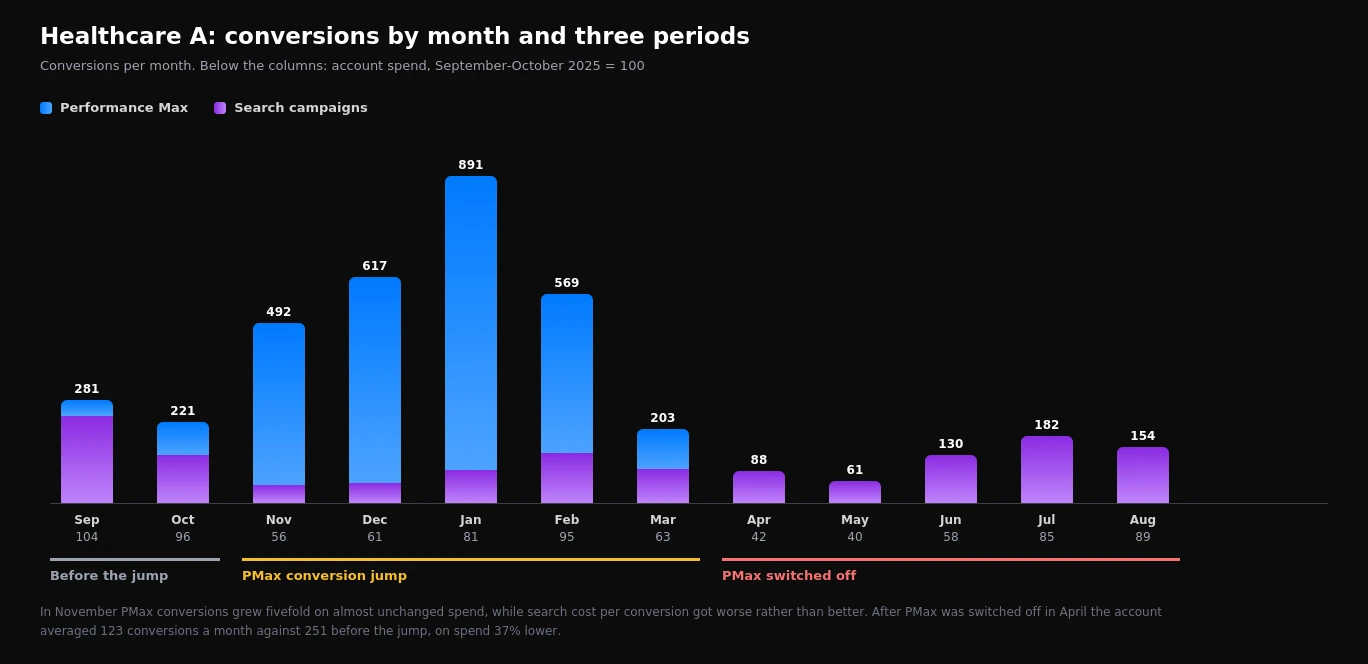
| Period | Monthly spend | Conversions per month | Cost per conversion | PMax share of conversions |
|---|---|---|---|---|
| September-October 2025 | 100 | 251 | 100 | 27% |
| November 2025 - March 2026 | 71 | 554 | 32 | 85% |
| April-August 2026, PMax switched off | 63 | 123 | 128 | 0% |
In November Performance Max conversions grew fivefold in a single month, while its spend actually dipped slightly. PMax cost per conversion fell roughly eightfold compared with September and October. The account started receiving more than twice as many conversions for less money.
In April Performance Max was switched off. After that the account averaged 123 conversions a month, half the level before the jump, on spend 37% lower. Cost per conversion came out 28% above the September-October level.
These numbers support two opposite stories.
The first: Performance Max found cheap patients outside search, and switching it off cost the account three quarters of its enquiries.
The second: the jump had nothing to do with patients. The campaign found placements where the callback widget fired in bulk: accidental interactions, low-quality traffic or bots. The numbers went up while real enquiries did not.
Ad platform data alone cannot settle it, but several signs point to the second story. Conversions rose fivefold within a month with no increase in spend. Search campaigns working the same demand did not improve over that period; they got worse, whereas genuine growth in demand would have lifted both channels. 96% of conversions came from outside search. And the conversion action itself is a widget request, which is easy to trigger without real intent.
Only the CRM holds the final answer: how many real calls and booked patients there were from November to March compared with September and October.
Conversions jumped sharply while spend did not. Other campaigns targeting the same demand did not improve at the same time. Most PMax conversions do not come through search queries. The conversion is a soft on-site action: a widget, a form opening, a tap on a phone number. If even two of these coincide, that is a reason to check the CRM, not a reason to raise the budget.
So what does explain the gap
After three checks, the picture looks like this. Micro-conversions do not explain the gap. Brand explains part of it, but not the difference between channels. Display traffic explains it in only one account, and there the advantage itself is highly questionable.
In e-commerce and in Healthcare B, where PMax conversions come through search and do not depend on brand, the advantage is most likely real. There are several possible reasons. Performance Max bidding sees more signals and allocates budget across formats within a single auction decision. In e-commerce it uses a product feed with prices and images. And there is one more factor worth keeping in mind: data-driven attribution gives part of the credit to campaigns that touched the user earlier, and Performance Max touches the user in more places. That does not make the advantage fictional, but it does mean PMax's reported cost per conversion is somewhat more optimistic than reality.
And one lesson from another store, which we covered in our audit findings: after Performance Max was almost completely paused in February, the campaign never returned to its earlier efficiency over the following six months. A working PMax campaign is not a switch you can flip without consequences.
So should the whole budget go into Performance Max?
No, even taking all of the above into account. First, PMax's reported advantage rests partly on attribution, and the larger its share of the budget, the fewer campaigns remain to compare it against. Second, search campaigns offer what PMax does not: control over queries, dedicated copy for distinct intents, and a transparent report. Third, in lead generation the reported advantage may turn out not to be an advantage at all, as Healthcare A showed.
The setup we recommend: a separate branded search campaign, Performance Max with brand excluded, and non-branded search campaigns for key intents where control and copy matter. Budget is split between them on non-branded cost per conversion verified in the CRM, not on the number in the "Cost / conv." column.
What to check in your own account
| Check | Where to look | What should worry you |
|---|---|---|
| Conversion mix by channel | Campaigns report, Conversion action segment | PMax and search count different actions, or two primary actions for one event |
| Brand share | PMax search category insights, search terms report | Over 20% of any channel's conversions come from queries containing the company name |
| Non-branded cost per conversion | The same insights, calculated by hand | Budget decisions are made on an average that includes brand |
| Where PMax conversions come from | Conversions from search categories against the total | Less than half of conversions come through search |
| Jumps | Monthly trend of conversions and spend | Conversions multiplied without a rise in spend |
| Quality | CRM, offline conversions | Google Ads conversions and real customers diverge |
For lead generation, the most reliable fix is to send Google Ads the CRM outcome rather than the form fill: a call that actually happened, or a customer who actually arrived. Performance Max then optimises for what the business needs rather than for what is easiest to count. We covered how to set this up, and a new limitation to keep in mind, in our piece on offline conversions.
What this data does not prove
The sample is small, and these figures are an illustration rather than market statistics. It happens to contain no accounts where PMax loses to search, but that does not mean such accounts do not exist.
Search category insights contain no cost data, so the cost of branded conversions can only be estimated, and we did so conservatively. The unnamed category may hide more brand traffic.
We have no view of the CRM in any of these accounts. Everything said about conversion quality in Healthcare A is a hypothesis backed by indirect signs, not a proven fact.
Finally, we do not know why Performance Max was switched off in Healthcare A. Perhaps precisely because the CRM showed no additional real enquiries. Perhaps for other reasons.
This is part of a series of analyses based on our audit data. Earlier we covered search queries that never convert, conversion by device and seven findings on what holds advertising back, and PMax structure for online stores in a dedicated guide. If you want to check whether Performance Max's advantage in your account is real, talk to our team.
Want results like this for your brand?
Get a free strategy call and a tailored proposal within one business day.
Get a Free Proposal